
How to Build a Profitable Performance Marketing Funnel From Scratch
Ads, clicks and leads are the easy part. Building a funnel that survives contact with your margins is the work.
By Nikhil Khachane · Performance marketing consultant, Pune · 14 min read
Most businesses describe performance marketing in one line: run ads, get leads, increase the budget. It sounds like a machine. For a few weeks it even behaves like one — leads arrive, the cost per lead looks reasonable, and the obvious next move is to spend more.
Then the second month arrives. The sales team says the leads are weak. The owner asks how many actually bought. Nobody can answer, because the reporting stops at the form submission and the business result lives three steps further down. Budget goes up, results do not, and the campaign gets blamed for a measurement problem.
A profitable funnel is not a bigger version of that setup. It is one where advertising data is connected to lead quality, sales outcomes, customer acquisition cost, revenue and finally profit — so that every optimisation decision is made against a business number rather than a platform number.
What is a performance marketing funnel?
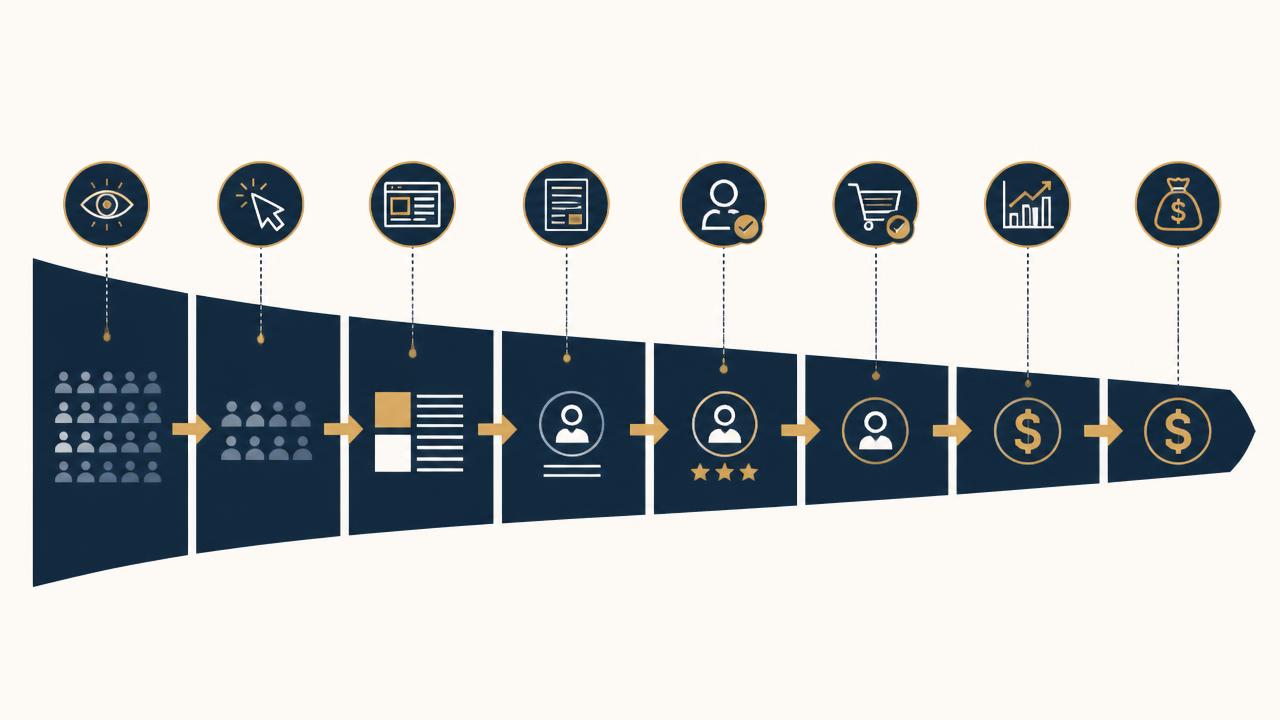
A performance marketing funnel is the measurable path a prospect takes from seeing a paid ad to becoming a profitable customer. Each stage has a cost, a volume and a conversion rate, which means you can locate exactly where money is being made and where it is leaking.
The classic marketing stages still exist inside it:
- Awareness — the audience learns you exist, usually through social, video or display placements.
- Consideration — they compare, research and read; this is where search behaviour usually starts.
- Conversion — an enquiry, a call, a booking or a purchase.
- Qualification — someone decides whether the enquiry is worth pursuing.
- Sales — quotation, negotiation, closure.
- Retention and revenue — repeat orders, renewals, referrals, where the model allows.
The difference is accountability. A traditional funnel describes buyer psychology. A performance marketing funnel attaches a number to each step and forces the question: what did this stage cost, and what did it return?
Lead funnel vs profitable performance marketing funnel
Most accounts are running a lead funnel and calling it performance marketing. The difference is not effort — it is where the measurement stops.
| Lead funnel | Profitable performance funnel | |
|---|---|---|
| Primary objective | Generate as many leads as possible | Acquire customers at a profitable cost |
| Optimisation | Lower CPL, more volume | Lower CPQL and CAC, better lead quality |
| Metrics | Clicks, CTR, CPL, lead count | CPQL, CAC, revenue, ROAS, gross profit |
| Data source | Ad platform reporting only | Ad platform plus CRM and sales data |
| Sales connection | Leads are handed over and forgotten | Sales outcomes flow back into campaign decisions |
| Decision making | Reactive — react to CPL movement | Diagnostic — fix the stage that is leaking |
| Scaling | Increase budget when CPL looks good | Increase budget when unit economics repeat |
| Business outcome | Busy sales team, unclear returns | Predictable customer acquisition |
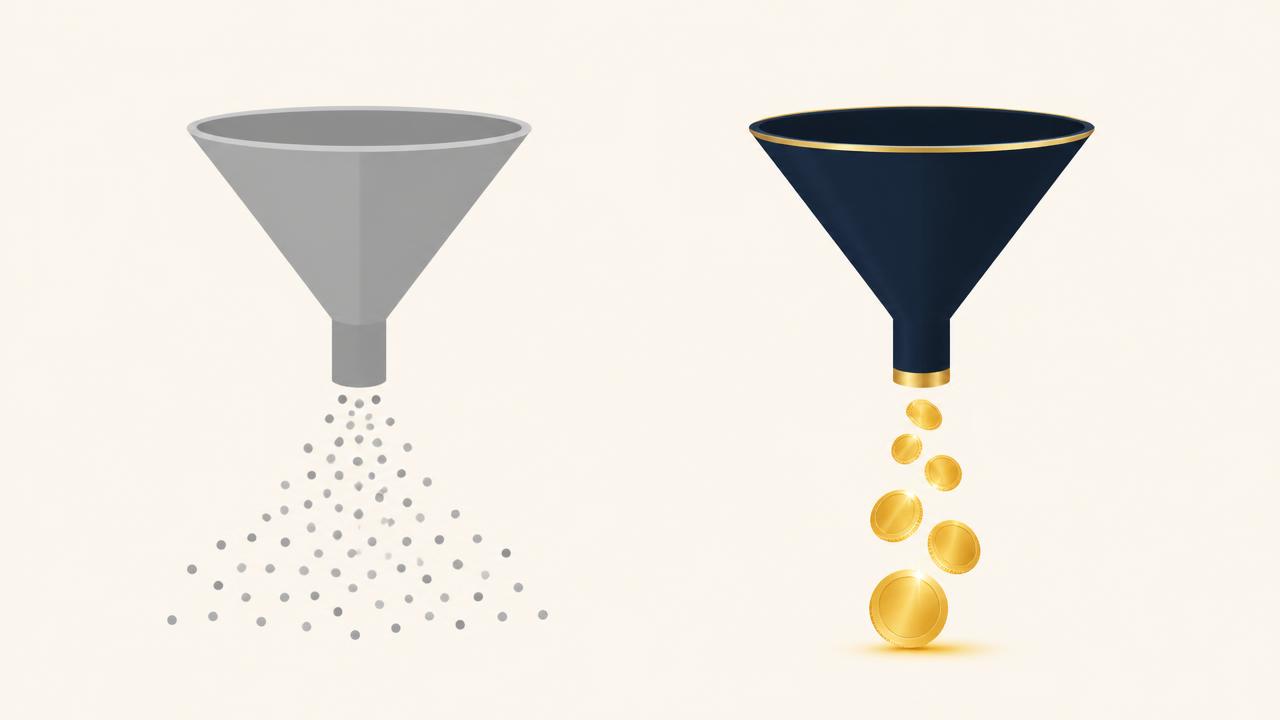
Why can 500 leads be worse than 100? Because leads consume capacity. If 500 cheap enquiries qualify at 5%, sales speaks to 25 useful people and wastes weeks on the rest. If 100 sharper enquiries qualify at 40%, sales speaks to 40 useful people and has time to follow up properly. The same budget produced fewer leads and more revenue — and the campaign that looked worse in the ad account was the one worth scaling. This is the same logic behind optimising Google Ads for revenue instead of lead volume.
The Ad-to-Revenue Funnel
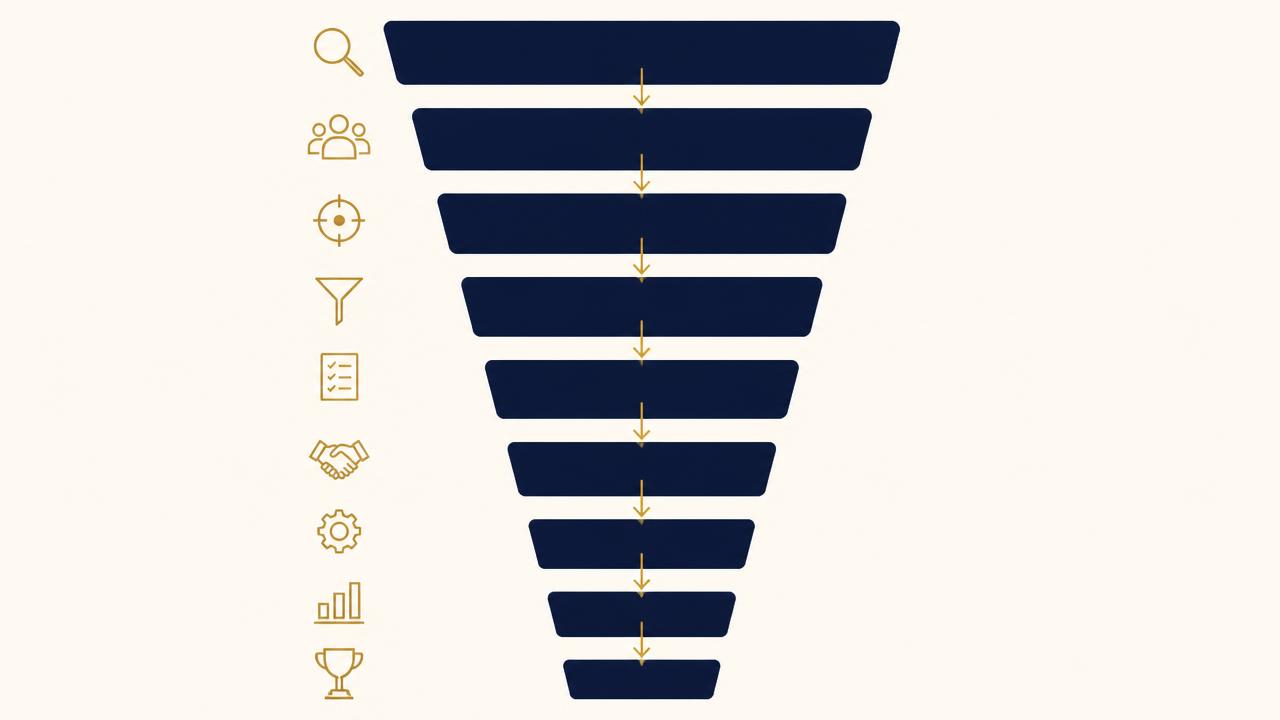
This is the framework I use to audit and rebuild paid accounts. It has nine stages, and its only rule is that a campaign can look healthy at any stage above and still be unprofitable at the bottom.
Ad impression → Click → Landing page → Lead / Purchase → Qualified lead → Sales opportunity → Customer → Revenue → Profit
Stage 1 — Ad impression
Impressions · Reach · Frequency · CTR
Your ad was served. Nothing has been earned yet. Impressions only tell you that the auction let you in and the budget is being spent. Watch frequency here — the same people seeing the same creative repeatedly is the earliest sign of fatigue.
Stage 2 — Click
Clicks · CPC · CTR · Search intent
Someone found the message relevant enough to act. On Search, look at the query behind the click, not just the keyword you bid on. A high CTR on the wrong intent is an expensive form of enthusiasm.
Stage 3 — Landing page
Page speed · Engaged sessions · Landing page conversion rate
This is where most paid budgets quietly die. If clicks are steady and leads are not, the page and the offer are the suspects, not the ads. Check load time on a mid-range Android phone on mobile data, not on your office Wi-Fi.
Stage 4 — Lead or purchase
Conversion rate · CPL · CPA
The visitor gave you something: a form, a call, a WhatsApp message, an order. For e-commerce this is close to the business outcome. For lead generation, it is barely the halfway mark.
Stage 5 — Qualified lead
Qualification rate · CPQL
Someone reviewed the lead and confirmed it fits — right requirement, right budget band, right location, reachable. This is the first stage where quality is measured instead of assumed, and the first place cheap leads are exposed.
Stage 6 — Sales opportunity
Opportunity rate · Cost per opportunity
A real deal is in motion: a quotation sent, a site visit booked, a demo scheduled, a sample dispatched. Opportunity rate tells you whether your qualified leads are genuinely interested or merely polite.
Stage 7 — Customer
Close rate · CAC
Money changes hands. CAC is calculated against this stage, and it is the first number a business owner instinctively understands. Everything above it is diagnostic; this is the outcome.
Stage 8 — Revenue
Revenue · Revenue per customer · ROAS
What the customer actually paid, including repeat orders where your model has them. Revenue per customer is what makes an apparently expensive CAC affordable — or an apparently cheap one pointless.
Stage 9 — Profit
Gross profit · Contribution margin · ROI
Revenue minus cost of delivery, ad spend and the operational cost of servicing the customer. A funnel is only profitable at this stage, and this is the only stage a business is actually run on.
Five sentences worth pinning above the dashboard
- High CTR does not mean a profitable campaign.
- Low CPL does not mean good leads.
- High lead volume does not mean more sales.
- High conversion rate does not mean high profit.
- High ROAS does not necessarily mean healthy net profit.
Step 1 — Define your business goal before running ads
The campaign objective should be the business outcome expressed in platform language. When they drift apart, the platform optimises perfectly toward the wrong thing.
- Lead generation — enquiries a sales process can work with
- E-commerce sales — orders with values attached
- App installs — and, more usefully, activated users
- Bookings — appointments, test drives, site visits
- Real estate enquiries — site visits, not brochure downloads
- SaaS demos — demos that actually take place
- Local service enquiries — calls and WhatsApp messages from the service area
A Pune interior design studio does not need 300 enquiries; it needs twelve site visits from homeowners in a workable budget band. A D2C skincare brand needs orders at a recoverable cost, not add-to-carts. Write your goal as a number of business events per month before you open the ads platform.
Step 2 — Define your ideal customer
Targeting settings are not a customer definition. Before writing an ad, you should be able to state:
- The problem they are trying to solve, in their words
- Their buying intent — urgent need, planned purchase or idle research
- Location, and whether you can realistically serve it
- Relevant demographics, only where they genuinely change the offer
- What they search for, including the comparison and price queries
- Their pain points and the trigger that makes them act now
- Their objections — price, trust, timeline, past bad experience
- Average order or customer value
Poor customer definition breaks technically excellent campaigns. A gym running ads across an entire city will get cheap leads from people who live forty minutes away and will never walk in. Nothing in the account is misconfigured; the audience simply cannot become customers. This is exactly why cheap leads can be more expensive than expensive leads.
Step 3 — Calculate your target CAC and break-even economics
This is the step most businesses skip, and it is the one that decides whether the funnel can ever be profitable.
CAC = Total marketing and sales acquisition cost ÷ Number of new customers
Break-even CAC is the point where the gross profit from a customer exactly equals the cost of acquiring them. Spend more than that and you buy customers at a loss; spend well under it and you are probably leaving growth on the table.
Worked example (illustrative)
- Revenue per customer: ₹25,000
- Gross margin: 60%
- Gross profit per customer: ₹15,000
₹15,000 is the absolute ceiling — the point at which acquiring the customer earns nothing. A business that also pays for salaries, tools, delivery and overheads needs its CAC comfortably below that. Many owners in this position work toward a CAC in the region of a third of gross profit, but that is a decision about your own cost base, not a rule.
Your acceptable CAC depends on:
- Gross margin
- Customer lifetime value and repeat purchase behaviour
- Sales costs — commissions, calling teams, field visits
- Operational cost of servicing the customer
- Refund, cancellation and no-show rates
There is no universal CAC benchmark, and anyone quoting one for your industry is guessing. The only benchmark that matters is the one your own margins produce.
Step 4 — Choose the right advertising channel
Channel choice is a demand question, not a preference. Are you capturing demand that already exists, or creating it?
| Channel | Strongest use case | Typical intent | Funnel role |
|---|---|---|---|
| Google Ads | Existing search demand, local services, B2B research, high-intent lead generation | High — the user is already looking | Capture demand and convert it |
| Meta Ads | Demand generation, visual products, audience discovery, retargeting, lead forms | Low to medium — you interrupt, then persuade | Create demand and re-engage |
| YouTube Ads | Explaining a considered purchase, building familiarity before search | Low — attention borrowed, not requested | Awareness and consideration |
| LinkedIn Ads | B2B where job title, industry or company size defines the buyer | Low to medium, but precisely targeted | Reach niche B2B audiences |
In practice, most Indian businesses I work with start where demand already exists. If people are searching for what you sell, a well-structured Google Ads account usually produces measurable outcomes fastest. If nobody is searching yet — a new product, a new category, a visual purchase — Facebook and Instagram campaigns have to create the demand before search can capture it. Neither platform is universally better; they are answers to different questions.
Step 5 — Build the ad → landing page → conversion journey
The single most common cause of a weak funnel is a break in the chain of message. The visitor should never have to reconcile what the ad said with what the page shows.
Ad message → Landing page headline → Offer → CTA → Form or purchase
A page that converts paid traffic usually has:
- One specific offer, not a menu of services
- A headline that repeats the promise from the ad
- Benefits written as outcomes, not features
- Genuine social proof — real work, real names, nothing invented
- Trust signals: address, phone number, response time, service area
- One clear call to action repeated down the page
- A form short enough to finish on a phone, on mobile data
Weak
Ad: "Best interior designers." Page: company homepage, twelve services, a contact form at the bottom, "Submit".
Strong
Ad: "2BHK interior packages in Pune — get a room-wise estimate." Page: same headline, package range stated, photos of completed 2BHK work, four-field form, "Get my estimate".
The second version will usually produce fewer leads and a higher CPL. It will also produce enquiries from people who already accept the price band — which is the entire point.
Step 6 — Set up conversion tracking correctly
Tracking is not reporting admin. It is the instruction set your bidding algorithm learns from. Feed it noise and it will optimise faithfully toward noise.
Depending on the setup, that usually means:
- Google Ads conversion actions for the events that matter, deduplicated
- Meta Pixel plus the Conversions API for server-side reliability
- GA4 configured so key events match your ad platform definitions
- Form submission tracking that fires on success, not on button click
- Phone-call tracking, including calls from ad extensions
- WhatsApp click tracking, since so many Indian enquiries start there
- CRM integration carrying source, campaign and keyword with each lead
- Offline conversion imports pushing qualified and closed outcomes back
The distinction to preserve everywhere is: lead generated → lead qualified → sale → revenue. If your account only knows the first of those, it will keep buying more of the first. Getting this layer right is specialised work; it is the reason conversion tracking and analytics setup deserves its own project rather than an afternoon.
Step 7 — Connect advertising data with CRM and sales data
A funnel becomes genuinely useful the moment marketing numbers and sales numbers sit in the same view. Consider an illustrative month:
- 100 leads
- ↓ 40 qualified leads (40%)
- ↓ 15 sales opportunities (37% of qualified)
- ↓ 8 customers (53% of opportunities)
- ↓ ₹2,40,000 revenue (₹30,000 per customer)
Now the conversation changes. If only 40% of leads qualify, the problem is upstream — targeting, offer or message. If qualification is strong but only 37% become opportunities, the issue is follow-up speed or the sales conversation, not the ads. The useful question stops being "can we lower CPL?" and becomes: which part of the funnel is preventing profitable growth? The mechanics of stitching this data together are covered in more depth in the guide to measuring performance from ad clicks to revenue.
Step 8 — Measure the right performance marketing metrics
| Metric | Formula | What it tells you |
|---|---|---|
| CTR | Clicks ÷ Impressions | Whether the message earns attention |
| CPC | Spend ÷ Clicks | What traffic costs in your auction |
| CVR | Conversions ÷ Clicks | Whether the page and offer convert |
| CPL | Spend ÷ Leads | What a contact detail costs |
| CPQL | Spend ÷ Qualified leads | What a genuinely useful lead costs |
| CAC | Acquisition cost ÷ New customers | What a paying customer costs |
| ROAS | Revenue ÷ Ad spend | Revenue produced per rupee of ad spend |
| ROI | (Return − Total cost) ÷ Total cost | Whether the whole activity made money |
No metric in that table should be read alone. CTR without conversion rate flatters curiosity. CPL without qualification rate flatters volume. ROAS without margin flatters revenue. Read them as a chain, top to bottom, and the story usually becomes obvious within a minute.
Step 9 — Find where your funnel is losing money
Diagnosis is a matter of finding the first stage where the numbers fall off a cliff. Fix that stage before touching anything below it.
| Symptom | Likely cause | Where to act |
|---|---|---|
| High impressions, low CTR | The message, creative or targeting is wrong | Rewrite the hook around the customer's problem; tighten audience or keywords |
| High CTR, low page conversions | The landing page or offer breaks the promise | Match the headline to the ad, cut form fields, add proof, fix mobile speed |
| Low CPL, poor lead quality | The offer is too easy to accept | Add qualifying questions, state price bands and service areas, narrow targeting |
| Good leads, poor sales | The follow-up process, not the ads | Measure response time, fix ownership and scripts, track every lead to an outcome |
| Good sales, low profit | Pricing, margin or CAC | Recalculate break-even CAC, review discounting, cut the worst-performing campaigns |
| Good ROAS, poor profit | Costs outside ad spend | Include delivery, returns, salaries and tools before calling the campaign a success |
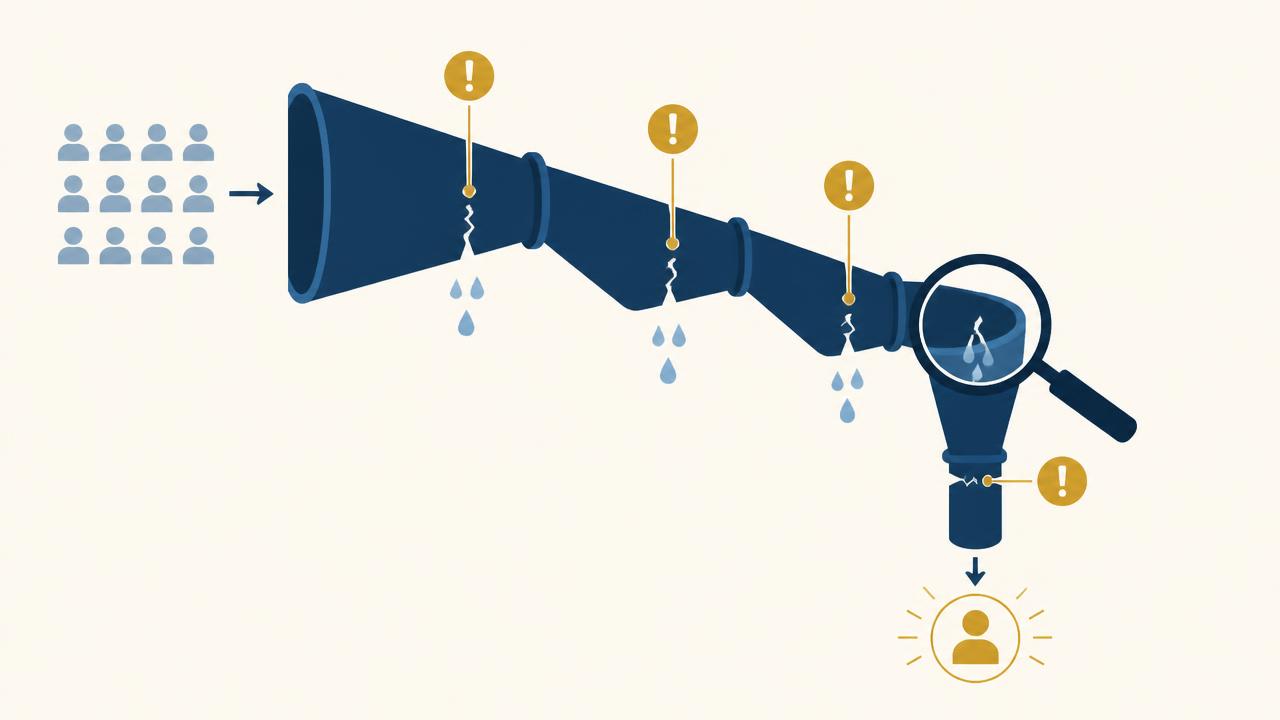
One caution: the symptom and the cause are frequently in different departments. "Leads are bad" is often a follow-up problem, and "sales is slow" is often a targeting problem. The funnel numbers settle that argument without anyone having to win it.
Step 10 — Optimise before increasing your budget
More budget amplifies whatever the funnel already does. If 8% of leads qualify at ₹40,000 a month, they will still qualify at 8% at ₹1,00,000 — you will simply be buying more of the 92%.
Diagnose → Fix → Measure → Validate → Scale
Things worth testing, roughly in order of impact:
- The offer — usually the biggest single lever
- Landing page headline, form length and speed
- Audience definition, search terms and negative keywords
- Ad messaging and creative angles
- Call to action and what happens immediately after submission
- Lead qualification criteria and questions
- Follow-up process and response time
- Conversion tracking accuracy
- Bidding strategy and budget allocation
Change one meaningful thing at a time, and give it enough conversions to mean something. Five simultaneous changes on a Monday produce a result on Friday that nobody can explain or repeat.
When should you scale a performance marketing funnel?
Scale when all of these are true, not when one of them is:
- Tracking is reliable and you trust the conversion counts
- Lead quality is acceptable and measured, not assumed
- The lead-to-customer rate is known
- CAC sits comfortably below the gross profit per customer
- Revenue data flows back from the CRM
- Performance has held for several weeks, not one good week
- Your team can actually service more customers
More spend does not automatically produce more profit. As budget rises you reach broader, colder audiences, so conversion rates typically soften and CAC rises. A funnel at a ₹40,000 monthly budget with a ₹3,000 CAC might hold a ₹3,600 CAC at ₹80,000 — still fine if gross profit per customer is ₹15,000, and a problem if it is ₹4,000. Increase in steps of roughly 20–30% and re-check CAC after each step rather than doubling and hoping.
Practical example — building a funnel with a ₹50,000 monthly ad budget
Illustrative example — not a guaranteed benchmark. Your own CPC, conversion and close rates will differ.
- ₹50,000 ad spend
- ↓ ₹25 average CPC → 2,000 clicks
- ↓ 5% landing page conversion rate → 100 leads
- ↓ 40% qualification rate → 40 qualified leads
- ↓ 20% close rate on qualified leads → 8 customers
- ↓ ₹30,000 average customer revenue → ₹2,40,000 revenue
The derived numbers:
- CPL = ₹50,000 ÷ 100 = ₹500
- CPQL = ₹50,000 ÷ 40 = ₹1,250
- CAC = ₹50,000 ÷ 8 = ₹6,250
- ROAS = ₹2,40,000 ÷ ₹50,000 = 4.8x
- Gross profit at a hypothetical 40% margin = ₹96,000, less ₹50,000 ad spend = ₹46,000 contribution before overheads
Now change one number. If the margin were 20% instead of 40%, gross profit would be ₹48,000 against ₹50,000 of spend — a 4.8x ROAS that loses money. That is the whole argument for measuring profit rather than ROAS.
And if this campaign were unprofitable, where would I look first? Not at the bid strategy. The 5% page conversion rate and the 20% close rate are the two stages with the most room in them: lifting page conversion to 7% adds 40 leads at no extra spend, and lifting the close rate to 30% adds four customers from leads you have already paid for. Improving CPC from ₹25 to ₹22 would be a rounding error by comparison. Structuring campaigns around that kind of prioritisation is the core of lead generation work in Google Ads.
Common performance marketing funnel mistakes
- Optimising only for clicks
- Traffic is an input, not a result. A campaign can win on clicks and lose on customers.
- Chasing the cheapest leads
- The lowest CPL usually buys the least intent. Compare CPQL instead.
- Ignoring lead quality entirely
- If nobody marks leads good or bad, no one can improve them — including the bidding algorithm.
- Incorrect conversion tracking
- Duplicate conversions, page-view conversions and untracked calls all teach the platform the wrong lesson.
- Not connecting CRM data
- Without sales outcomes, every optimisation stops at the form submission.
- Sending every ad to the homepage
- A homepage answers ten questions. A landing page answers the one the ad raised.
- Scaling too quickly
- Doubling spend on an unvalidated funnel doubles the leak, not the profit.
- Changing campaigns every other day
- Too many simultaneous changes make it impossible to know what worked.
- Ignoring sales follow-up
- A lead contacted after two days is a different lead from one contacted in ten minutes.
- Reading ROAS without margins
- A 4x ROAS on 20% margins loses money. The number alone proves nothing.
- Running ads with no real offer
- "Contact us" is not an offer. A reason to act today is.
- Using one strategy on every platform
- Search intent and social discovery need different messages, pages and expectations.
Performance marketing funnel checklist
If you can tick every line below, you have a funnel rather than a set of campaigns.
- Business objective defined
- Target customer defined
- Target CAC calculated
- Break-even economics understood
- Channel selected for the right reason
- Offer created and written down
- Landing page built and speed-tested
- Conversion tracking installed and verified
- CRM connected to ad source data
- Lead qualification criteria agreed with sales
- Sales conversion rate measured
- Revenue tracked per customer
- CAC calculated monthly
- ROAS measured against margin
- Profitability reviewed, not assumed
- Scaling criteria written before scaling
If the funnel is built and growth still looks flat, the problem is usually one specific stage rather than the campaign. This walkthrough of why ads can be working while the business is not growing shows how to find it.
Google Ads and Meta Ads play different roles across this journey — one capturing demand, the other creating it. Where each fits is covered in Google Ads vs Meta Ads for lead generation.
Frequently asked questions about performance marketing funnels
A performance marketing funnel is the measurable path a paid-advertising prospect travels: ad impression, click, landing page, lead or purchase, qualified lead, sales opportunity, customer, revenue and finally profit. Unlike a traditional marketing funnel, every stage carries a cost and a conversion rate, so you can see exactly where money enters and where it leaks out.
The principle worth keeping
A profitable performance marketing funnel is not built by generating more traffic or more leads. It is built by understanding the entire journey — ad, click, conversion, qualified lead, sale, revenue, profit — and by fixing the stage that is actually holding the business back rather than the stage that is easiest to report on.
Start with the economics, build the journey, measure past the form submission, and only then spend more. That sequence is slower for a month and considerably faster after that.
I work with startups, e-commerce brands and local businesses on exactly this as a performance marketing consultant in Pune. If your funnel is producing leads but not profit, the fastest way to find out why is to look at the numbers together.
About the author
Nikhil Khachane is a performance marketing consultant based in Pune, working directly with businesses on Google Ads, Meta Ads, conversion tracking and revenue-focused reporting.
Related articles
How to Get Recommended by AI Search
A practical, no-guarantees guide to building the clarity, expertise, content, authority and technical access that support discovery across search and AI answers.
Google Ads and AI Search in 2026
AI Search is changing how people express intent and how Google Ads interprets it. A practical guide to campaigns, landing pages, conversion data and qualified growth.
Conversion Tracking for Google Ads & Meta Ads
Most accounts can report lead volume. Very few can say which campaigns produced customers. Here is how to connect ad clicks, leads, qualified leads and revenue.
Want this done for your account?
I run these campaigns for startups, e-commerce brands and local businesses from Pune — across India and the GCC.
Google Ads consultant in Pune
Search, Shopping and PMax managed for qualified leads.
Meta Ads consultant in Pune
Facebook and Instagram campaigns built around offer and creative.
Performance marketing consultant in Pune
Strategy, execution and measurement under one owner.
Google Ads lead generation
Lower cost per qualified lead, not just cheaper clicks.
Conversion tracking consultant in Pune
GA4, GTM, Meta CAPI and offline conversion imports.